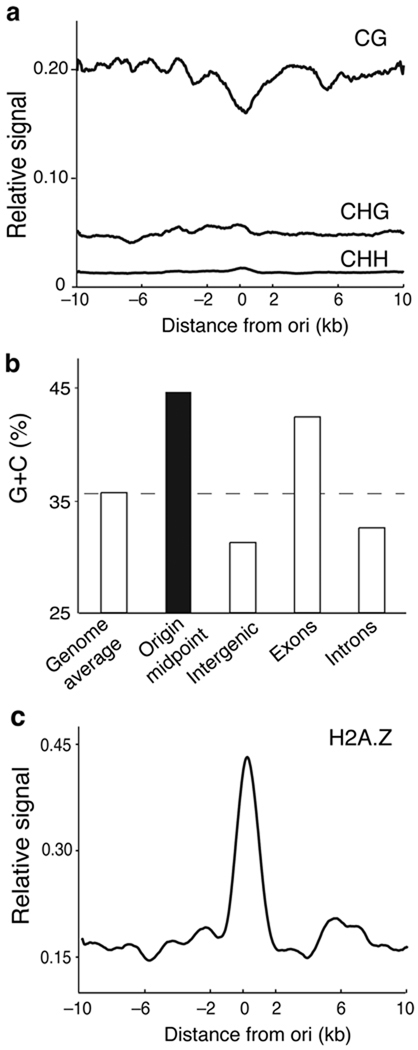
Figure 4. Relationship of Arabidopsis replication origins to CG methylation and histone H2A.Z.
(a) Relative levels of CG, CHG and CHH methylation were plotted ±10kb relative to the origin midpoint (0) in 50bp sliding windows (smoothed). Methylation data were published elsewhere 19. (b) G+C content (%) of replication origins (blue) and the indicated genomic regions (orange). These values were calculated from the sequence data files available at TAIR web site. (c) Density of the histone variant H2A.Z in a ±10kb region relative to the origin midpoint (0) in 50bp sliding windows (smoothed). The genomic distribution of H2A.Z was published elsewhere 32. The p-value of the difference in the ChIP-chip signals in origins, calculated as in Fig. 1b (see Methods), was 9.34e-34.

