
Figure 2.
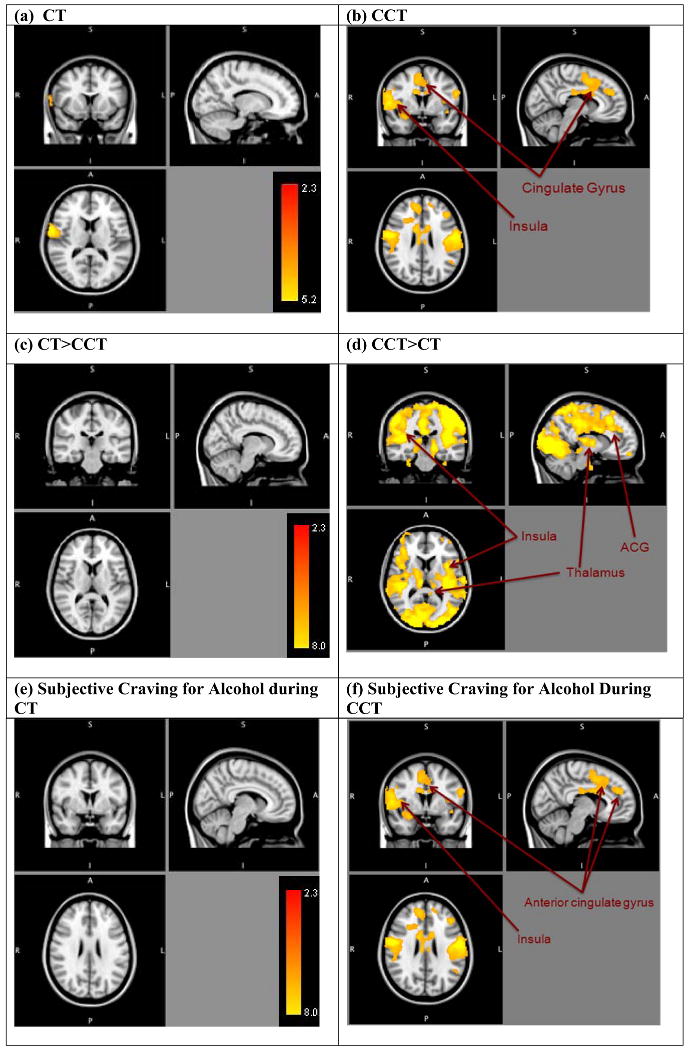
Areas of significantly positive correlation between [a] ChangeTalk (CT) and [b] CounterChange Talk (CCT) with BOLD response to alcohol taste cues (vs. control cues) (cluster-corrected p<.05, z=2.3), between [c] Change Talk vs. Counterchange Talk (CT>CCT), [d] and CounterChange Talk vs. Change Talk (CCT>CT), and BOLD response to alcohol taste cues (vs. control cues) (cluster-corrected p<.05, z=2.3), and between subjective ratings for alcohol during [e] Change Talk (CT) and [f] CounterChange Talk (CCT) with BOLD response to alcohol taste cues (cluster-corrected p<.05, z=2.3). Right side represents right hemisphere activations.