Fig. 2.
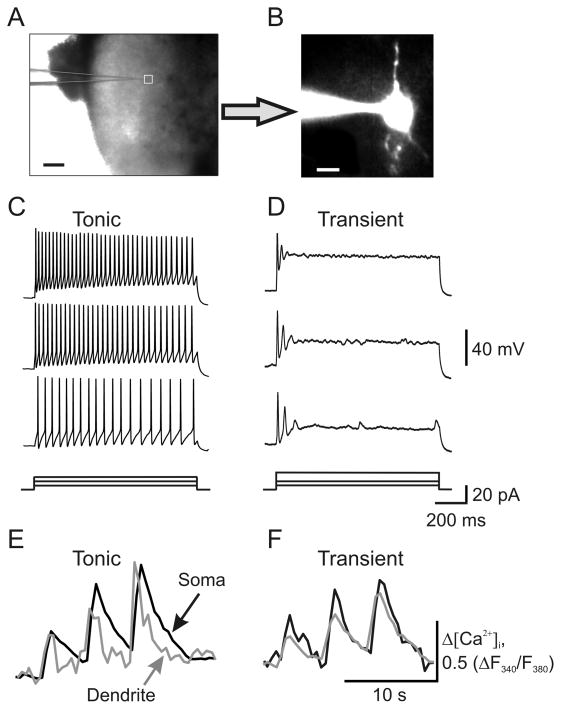
Sustained membrane depolarization revealed two groups of SG neurons exhibiting different discharge patterns. (A) Transmitted light image of patch electrode position (square) in the SG of a transverse dorsal horn slice; scale bar = 200 μm. (B) A fluorescent image of a neuron loaded with fura-2 (200 μM); scale bar = 20 μm. (C, D) Current-clamp recordings of typical firing patterns for tonic (C) and transient (D) groups of neurons in response to three different intensities of depolarizing currents shown at the bottom of each panel. (E, F) Recordings of depolarizing current-induced changes in the cytosolic free calcium concentration ([Ca2+]i) in the soma (black traces) and dendrites (grey traces) in tonic (E) and transient (F) groups of neurons.

