
Fig. 6.
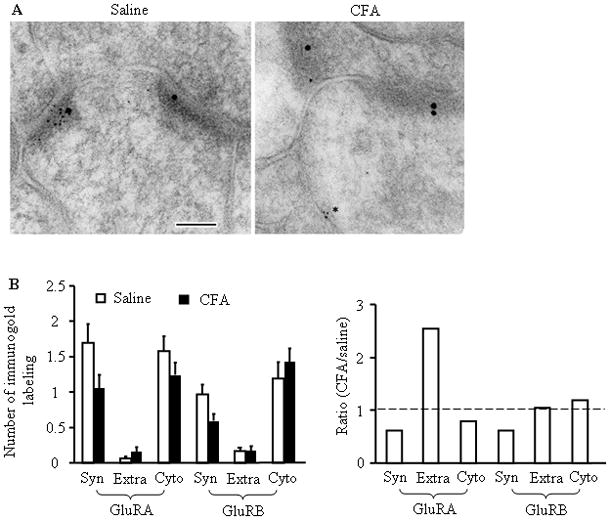
Ultrastructural distribution of GluR1 and GluR2 in the superficial dorsal horn 24 h after saline (left) or CFA (right) injection. (A) Representative micrographs of postembedding immunogold labeling for GluR1 (5 nm) and GluR2 (15 nm). In these representative images, the synapses are marked by the presence of GluR2; GluR1 is more prevalent at synapses in the saline-treated group. In the CFA-treated group, GluR1 is evident in the extrasynaptic membrane (asterisk). PSD, postsynaptic density; pre, presynaptic terminal; scale bar = 100 nm. (B) The left bar graph shows the number of GluR1- and GluR2-labeled immunogold particles at synapses (Syn), at extrasynaptic membranes (Extra), and in cytoplasm (Cyto) of superficial dorsal horn neurons 24 h after CFA or saline injection. The right bar graph shows ratios of the number of GluR1- and GluR2-labeled particles in the CFA-treated group to those in the saline-treated group at synapses, extrasynaptic membranes, and cytoplasm of superficial dorsal horn neurons 24 h after injections.