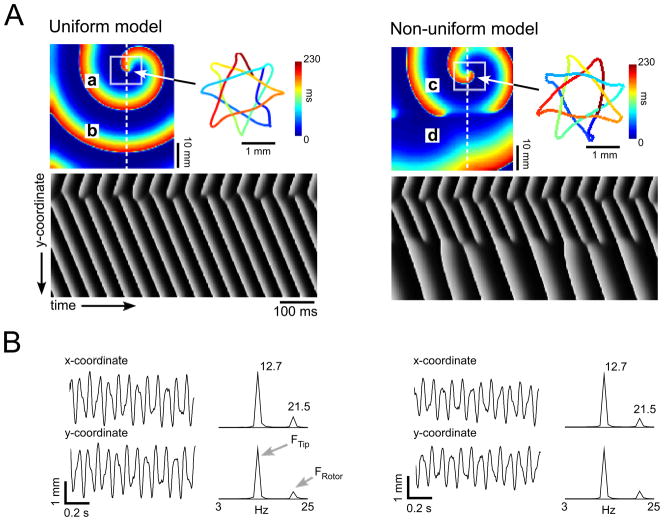
Figure 1.
Tip meandering and the power spectrum. A) Snapshots of spiral wave activity with octagon star-like meandering tip in uniform (left) and non-uniform (right) models. The tip was identified in the corresponding phase map as the point at which all phases converged. The tip trajectory was assembled by joining the tip locations in each consecutive frame; a-d sites of recordings in figs 2 and 3. Time-space plots of activity along the dashed white lines are shown at bottom; B) Tip x-y-coordinate signals and corresponding power spectra, for uniform (left) and nonuniform (right) models, both showing a dominant peak at 12.7 Hz.

