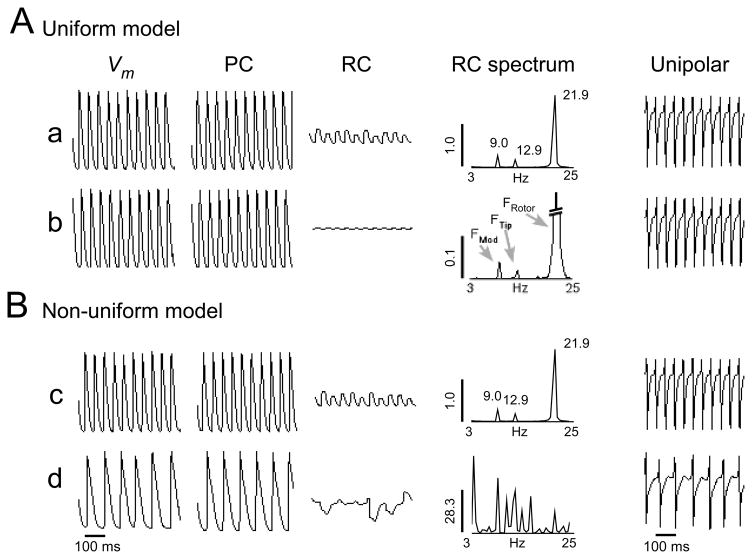
Figure 2.
A) Signal decomposition into periodic and residual constituents (RCs) at locations a and b as marked in figure 1A. All signals are shown with the same ordinate scale. The power spectra of the RCs are shown to their right, the pseudo unipolar electrograms are shown on the right-most column. B) Results for points c and d displayed as in panel A.

