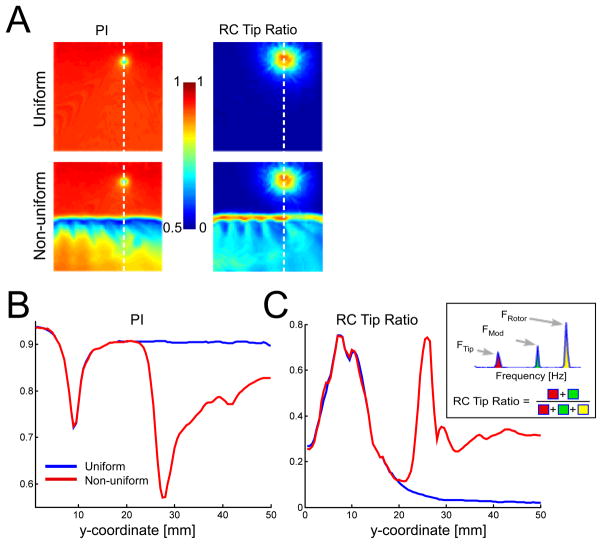
Figure 3.
Quantifying irregularity in the core and its periphery. A. Two-dimensional maps of periodicity index (PI) and residual component (RC) tip ratio. B and C vertical profiles of PI and RC tip ratio, respectively, along the line marked in panel A. The inset provides a diagrammatic definition of RC tip ratio in a simplified power spectrum with a total of 3 peaks, two of which correspond to the spiral tip meandering.

