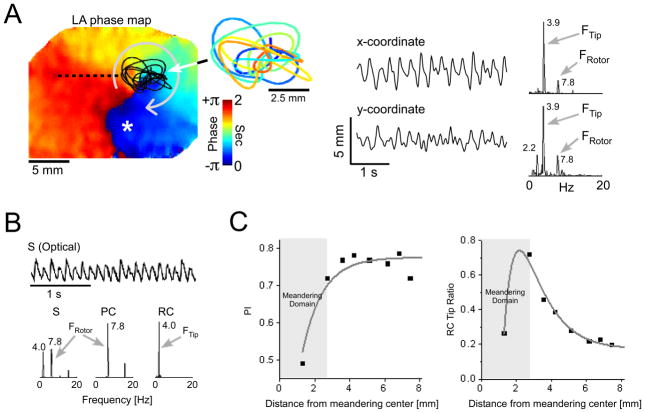
Figure 5.
Rotor meandering and fractionation in optical mapping experiment during AF in isolated sheep heart. A) Left atrial phase snapshot demonstrating reentrant activity in the LA free wall. The time-space trajectory of the tip, the x and y-coordinate signals and their corresponding spectra are shown on the right. B) Power spectra of a single optical signal (S) and its periodic and residual constituents (PC and RC) at the location marked by an asterisk in panel A. The original optical signal is shown at the top trace. C) PI and RC tip ratio as a function of the distance from the meandering center along black dashed line in A.

