Figure 4.
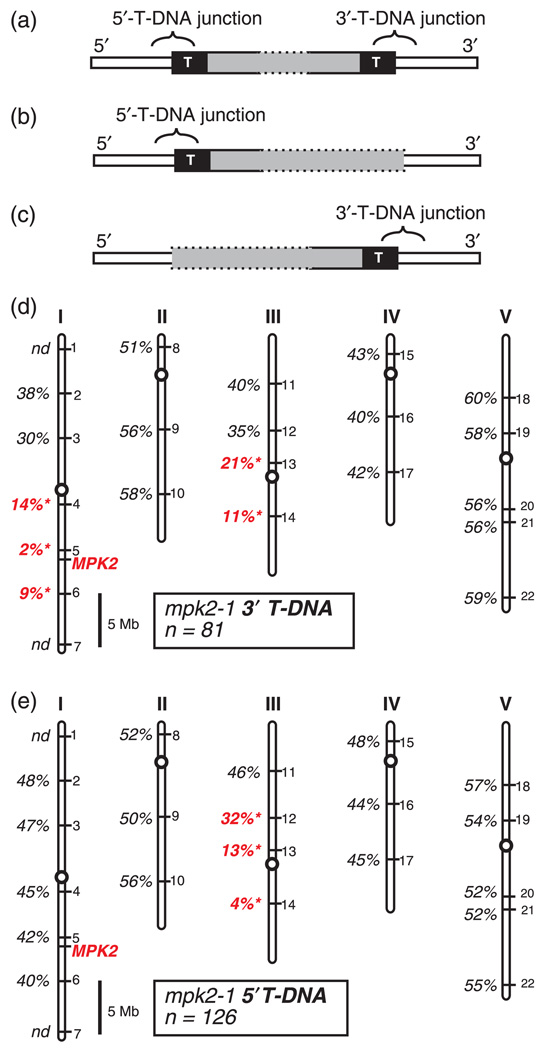
Genetic mapping the 5′- and 3′-T-DNA junctions of mpk2-1, (a–c) Schematic representation of theoretical T-DNA junction configurations. Generic T-DNA insertion loci are depicted with the T-DNA vector sequence indicated by gray, the Arabidopsis chromosome indicated in white, and the T-DNA border sequences represented as black boxes with the letter ‘T.’
(a) LocuswithdetectableT-DNAjunctionsonboththe5′ and 3′sidesofthe gene.
(b) Locus with a detectable T-DNA junction on only the 5′ side of the gene.
(c) Locus with a detectable T-DNA junction on only the 3′ side of the gene. (d–e) Locations of the mapping markers INDEL-1 to INDEL-22 on Arabidopsis chromosomes I–V are indicated by numbers on the right-hand side of each chromosome. Physical location of the MPK2 gene is shown in red. Percent recombination between each mpk2-1 T-DNA junction and the panel of mapping markers is shown. ‘nd’ indicates mapping not done for that marker. A recombination rate significantly different from 50% is indicated in red (P < 0.001). Scale bar is 5 Megabases.
(d) Mapping data for the mpk2-1 5′-T-DNA junction.
(e) Mapping data for the mpk2-1 3′-T-DNA junction.

