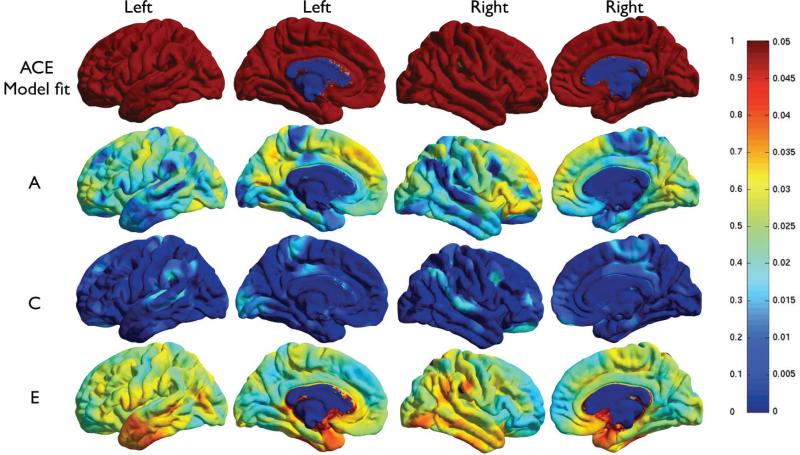
Figure 1.
A/C/E analysis of cortical thickness. The two leftmost columns show the sagittal and medial surface of the left hemisphere; the two rightmost ones show the right hemi- sphere. The color bar shows the color code used in the bottom three rows a2, c2 and e2 on the left, and associated p-values on the right. Top row: Regions are shown (in red) where the A/C/E model fits. Row 2 to row 4: Maps of the genetic (a2), combined environmental (c2) and unique environmental (e2) contributions to cortical thickness. Figures for cortical volume measures were visually similar and are not shown, but are available upon request.

