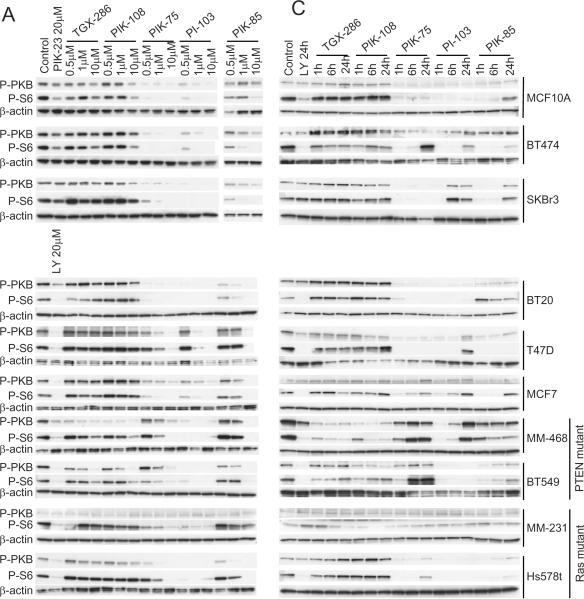
Figure 1. Dose-dependent and temporal biochemical responses of different breast cancer cell lines to increasing concentrations of isotype-selective PI3K inhibitors.
(A) MCF10A, BT474, SKBR3, BT20, T47D, MCF7, MDA-MB-468, BT549, MDA-MB-231 and Hs578t cells were cultured in six well dishes as described in Materials and Methods. The indicated concentrations of TGX-286, PIK-108, PIK-75, PI-103 and PIK-85 were added to the culture medium, and one hour later cells were harvested into lysis buffer. Proteins were separated by SDS-PAGE, and Western blotted using antibodies against phospho-PKB/Akt (Ser-473), phospho-S6 (Ser-235,236) and β-actin. Proteins were visualized by horse radish peroxidase coupled secondary antibodies and enhanced chemiluminescence (B) Graph displaying the in cell IC50 values for phospho-PKB/Akt (Ser-473), phospho-GSK3 (Ser-9/Ser-21) and phospho-S6 (Ser-235,236) in the different cell lines against the p110 isoform selective inhibitors. (C) MCF10A, BT474, SKBR3, BT20, T47D, MCF7, MDA-MB-468, BT549, MDA-MB-231 and Hs578t cells were cultured in six well dishes as described in Materials and Methods. 1 μM of TGX-286, PIK-108, PIK-75, PI-103 and PIK-85 were added, and the cells harvested into lysis buffer 1, 6 and 24 hours later. Proteins were separated by SDS-PAGE and analyzed by Western blotting with the indicated antibodies.


