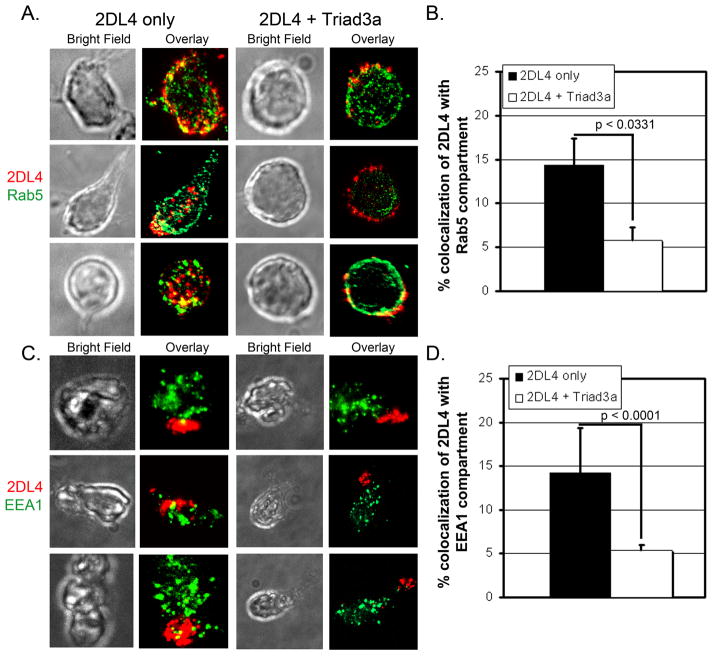
Figure 8. Intracellular trafficking of engaged 2DL4 to early endosomes is reduced by Triad3A.
KHYG-1 cells transduced to express myc-2DL4 ± Triad3A were stained with anti-myc Ab + AlexaFluor 647-labelled secondary Ab on ice, cultured at 37°C for 2 h (A,B) or 1 h (C,D), settled onto poly-L-lysine coated slides, fixed, permeabilized, and stained with polyclonal antibody to early endosomal markers (Rab5, A,B or EEA1, C,D) + secondary Ab conjugated with AlexaFlour 350. Cells were imaged by bright field (BF) and immunofluorescence microscopy for myc (2DL4; red) and Rab5 or EEA1 (green). A, Bright field and overlayed max-projected fluorescence images of all z-stack sections from three representative cells stained for Rab5 from each condition (± Triad3A expression). B, Mean ± S.E. percentage area of 2DL4 compartmentalized with Rab5 was quantified using Meta Vue software from max-projected images of z-stacks of 12–15 cells for each bar. C, Bright field and overlayed max-projected fluorescence images of all z-stack sections stained with EEA1 from three representative cells from each condition. D, Mean ±S.E. percentage area of 2DL4 compartmentalized with EEA1 was quantified using NIS-Elements software from all of the individual z-sections from 15 cells for each bar (>200 data points/bar). Percentage values were compared using the 2-tailed Mann-Whitney test and resulting p values are listed in panels B and D.

