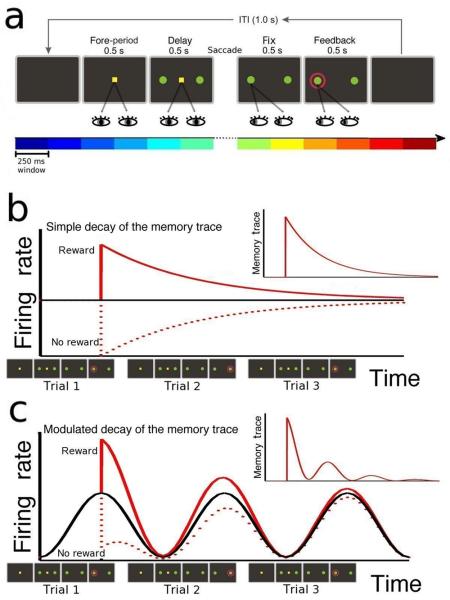
Figure 1.
Behavioral task and schematic illustration of memory traces. (a) In the matching pennies task, the monkey was required to fixate a central spot during the fore-period (500 ms) and delay period (500 ms) while the two choice targets (green disks) were displayed. Then, the central spot disappeared and the monkey made a saccadic eye movement to one of the two choice targets, and maintained its gaze on the chosen target for 500ms (choice fixation). A red ring appearing around the correct target revealed the computer's choice, and if it matched the animal's choice (as illustrated), reward was delivered 500 ms later. Coloured bars at the bottom show the twelve 250ms intervals (epochs) used to compute the firing rates in the analysis. (b,c) Two hypothetical neurons. The neuron in panel b has a constant average firing rate (black line), while the firing rate of neuron in panel c depends on the trial epoch, repeating in each of the three consecutive trials. Red lines show the change in activity due to the outcome in the first trial (continuous line – reward, dashed line – no reward). The inset shows the memory trace of the reward, given by the difference between the red and black lines. The memory trace of neuron in panel b shows a simple decay, while that of neuron in panel c is multiplicatively modulated by the epoch-dependent activity.

