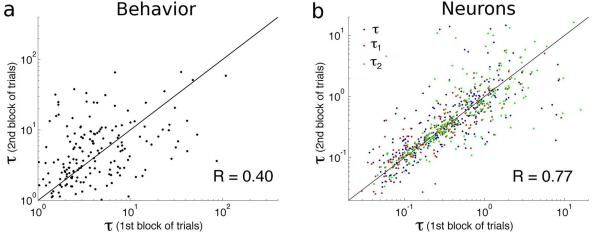
Figure 6.
Stability of behavioural (a) and neural memory timescales (b) within an experimental session. In both panels, the scatterplot of the timescales fitted in the second half of the trials is plotted against the timescales fitted in the first half of the trials in the same session. The correlation is significantly different from zero in both cases (R=0.4 for behavioural timescales, R=0.77 for neural timescales), suggesting that both types of timescales are fairly stable within a single session. Neural memory timescales from different types of fit (τ from single exponential and τ1, τ2 from double exponential) are shown in different colours.

