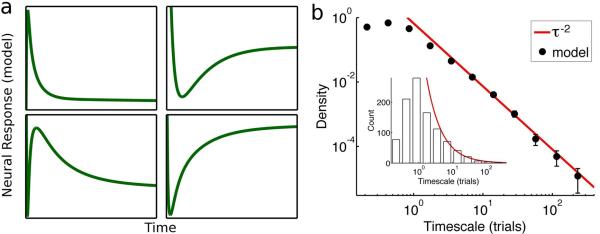
Figure 7.
Neural responses (memory traces) in the model and distribution of timescales of the memory traces in model neurons. (a) The memory traces of four model neurons. (b) Black disks show the density of timescales in the corresponding bin, i.e. the count of timescales divided by the bin length (error bars, ±SE). The inset shows the count of the timescales in the same bins, in linear scales (a total of 1000 timescales). The red line (red curve in the inset) shows a power law fit (exponent = −2).

