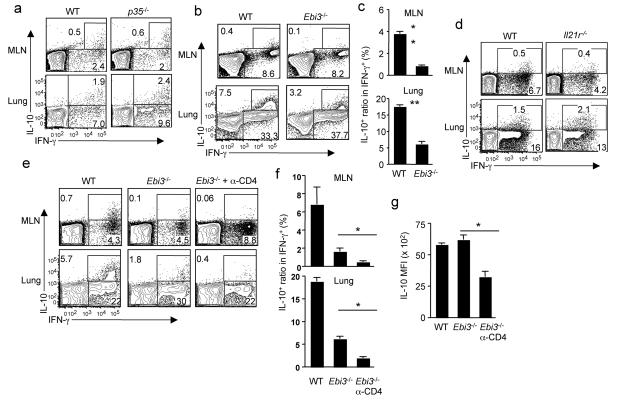
Figure 1. Induction of IL-10 producing CTL in vivo requires IL-27 and CD4+ T cells.
(a) WT or p35−/− mice were infected with influenza. At d7 p.i., the production of IL-10 and IFN-γ by CTL from MLN or lungs was measured by ICS. (b, c) WT or Ebi3−/− mice were infected with influenza. At d7 p.i., the production of IL-10 and IFN-γ by CTL from MLN or lungs was measured by ICS. (c) The normalized percentages of IL-10+ cells in influenza-specific CTL (IFN-γ+) from MLN or lungs of infected WT and Ebi3−/− mice are depicted. (d) WT or Il21r−/− mice were infected with influenza. At d7 p.i., the production of IL-10 and IFN-γ by CTL from MLN or lungs was measured by ICS. (e, f, g) WT, Ebi3−/− or CD4+ T cell-depleted (α-CD4) Ebi3−/− mice were infected with influenza. At d7 p.i., the production of IL-10 and IFN-γ by CTL from MLN or lungs was measured by ICS. (f) The normalized percentages of IL-10+ cells in influenza-specific CTL (IFN-γ+) from MLN or lungs of WT and Ebi3−/− mice are depicted. (g) The mean fluorescence intensity (MFI) of IL-10 in IL-10+ cells from infected lungs is depicted. Numbers are the percentages of cells in gated population. *, P <= 0.05; **, P <= 0.01. Data are from one experiment, but are typical of those obtained from at least two.

