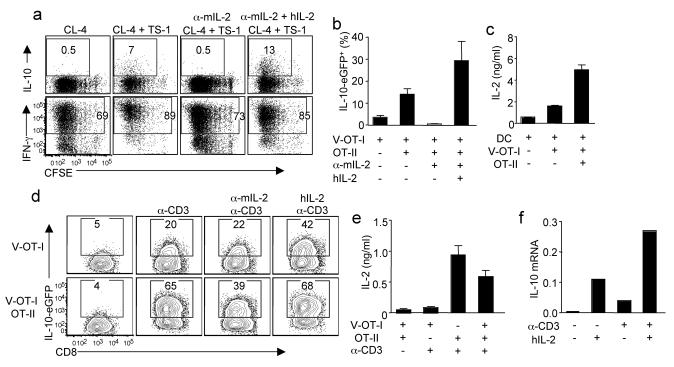
Figure 3. IL-2 provides the “help” from CD4+ T cell to CTL for IL-10 production in vitro.
(a) CFSE labeled CD8+ CL-4 cells were stimulated with influenza-infected DC in the presence or absence of CD4+ TS-1 cells for 4d. The cultured cells were treated with indicated conditions. Then the production of IL-10 and IFN-γ by CL-4 cells were measured through ICS. (b, c) CD8+ Vert-X-OT-I (V-OT-I) cells were stimulated with influenza-OVA-infected DC in the absence or presence of OT-II cells. (b) The percentages of IL-10-eGFP+ cells in V-OT-I cells are depicted. (c) The release of IL-2 into medium after 2d in culture was measured by ELISA. (d, e) V-OT-I or OT-II cells were activated separately by influenza-OVA-infected DC for 4d. The activated V-OT-I cells were unmanipulated or co-cultured with the activated OT-II cells. Cells were then either left unstimulated or stimulated with plate-bound anti-CD3 (α-CD3). The cultured cells were treated as indicated. (d) The expression of IL-10-eGFP by V-OT-I cells after 2d in culture was measured by flow cytometry. (e) The release of IL-2 into medium after overnight in culture was measured by ELISA. (f) OT-I cells were stimulated with influenza-OVA-infected DC. After 4 d in culture, OT-I cells were treated with hIL-2 or hIL-2 plus plate-bound α-CD3 for 4h. The expression of IL-10 was measured by quantitative RT-PCR. Numbers are the percentages of cells in the gated population. Data are from one experiment, but are representatives of at least 3 replicates.

