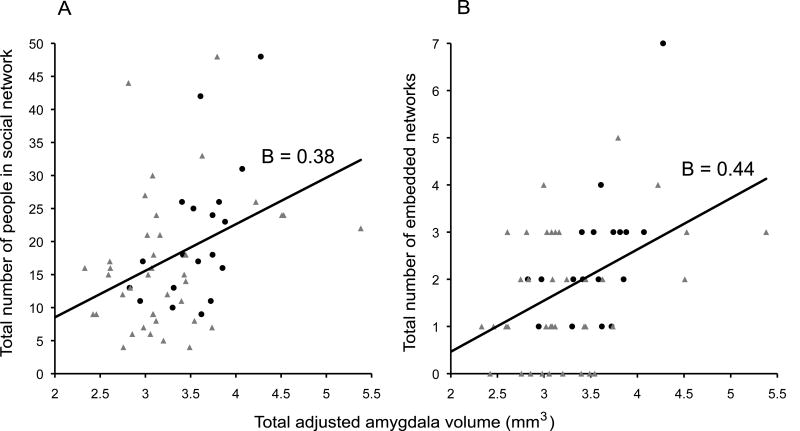
Fig. 1.
Amygdala volume correlates with social network size and complexity. Panels A and B plot social network variables (Y–axis) against total adjusted amygdala volume (X–axis). Data points from young participants are in black circles and older participants in grey triangles. A line of best fit with standardized regression coefficients (B) are also displayed for the entire sample.

