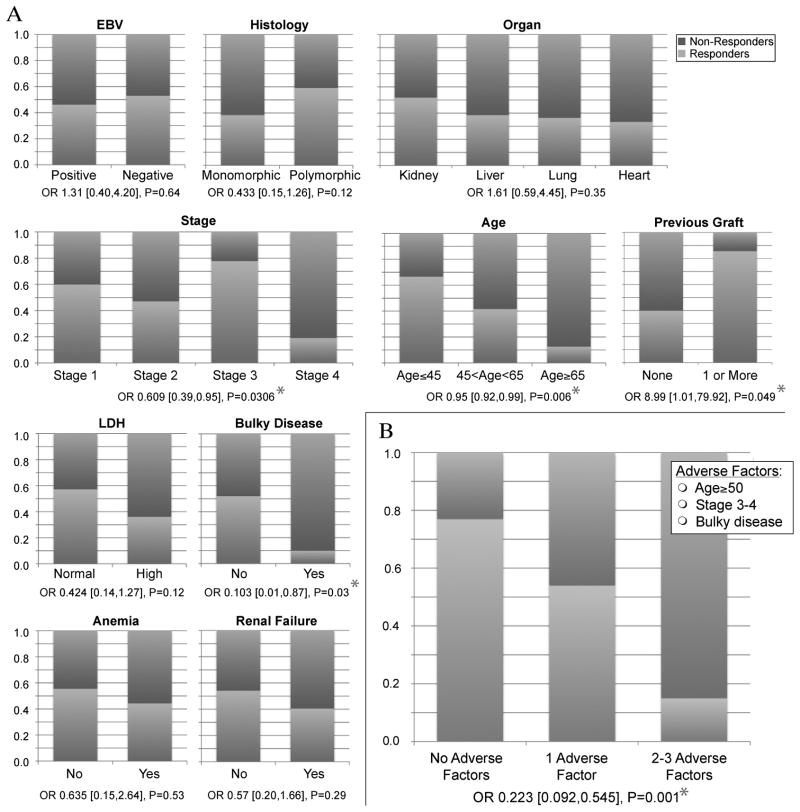
Figure 2.
Proportions of responding (Complete Response + Partial Response) and non-responding (Stable Disease + Progressive Disease) patients with PTLD following treatment with RI alone analyzed according to clinical and pathologic characteristics. Odds ratios indicate the difference in likelihood of response between subgroups and P-values indicate significance level in a logistic regression model. * P<0.05. A. Representative variables from Table 4. B. Prediction of response to RI using a summary of 3 independent adverse factors: Age≥50, advanced stage (3–4 vs. 1–2) & bulky disease (mass>7cm).

