
Figure 6.
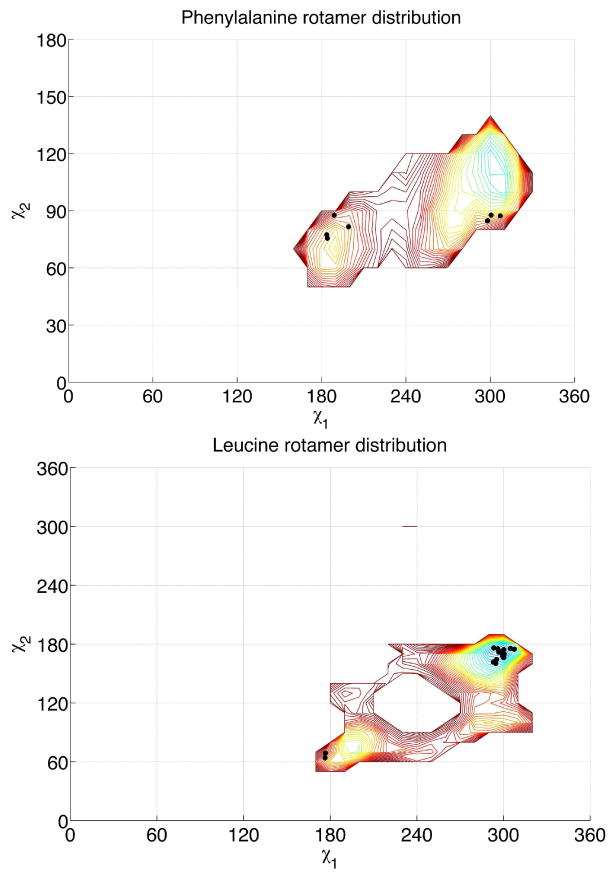
Contour plot of χ1/χ2 dependent rotamer probabilities for β3homoleucine and β3homophenylalanine in the β314 3.0 rotamer library. The negative logs of rotamer probabilities are indicated via the contour map, in 10°×10° bins. Experimental rotamers from the crystal structure22 are overlaid (black dots).