
Figure 1.
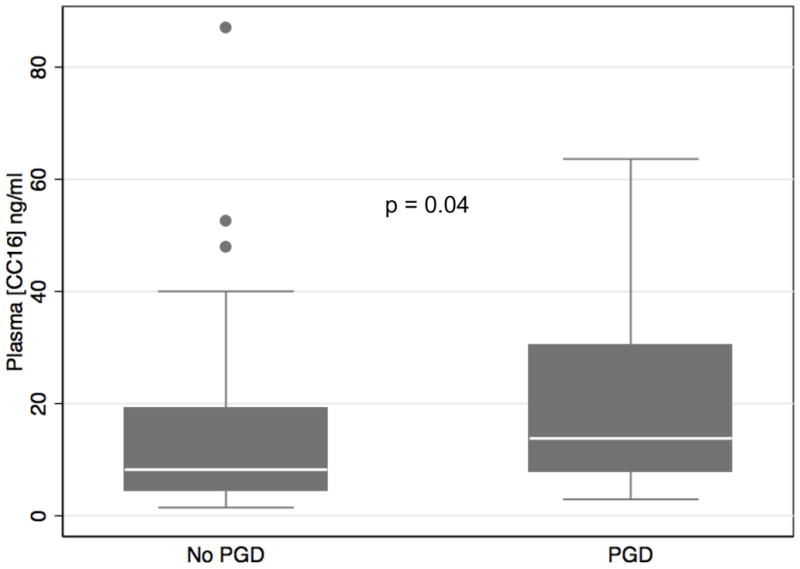
Plasma CC16 concentration 6 hours after transplant in all patients stratified by the development of Grade 3 PGD any time in the first 72 hours. Horizontal line indicates median concentration. The upper and lower limits of the box indicate the interquartile range. Solid circles represent outliers. P-value reported is from Wilcoxon rank sum test and is corrected for multiple comparisons.