
Figure 2.
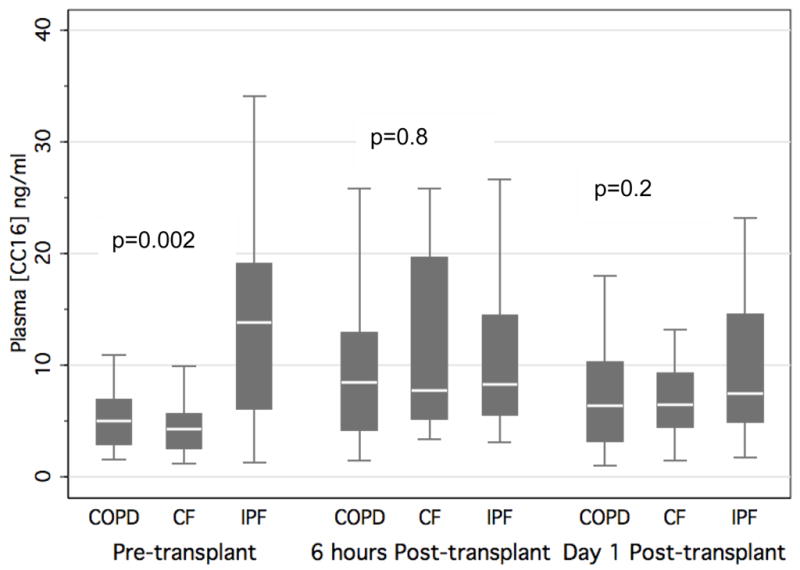
Plasma CC16 concentration pre-transplant, 6 hours post-transplant, and post-operative day 1 stratified by the three most common diagnoses leading to transplant in all patients. P-values reported are for Kruskal-Wallis equality-of-populations rank test.
Horizontal line indicates median concentration. The upper and lower limits of the box indicate the interquartile range.