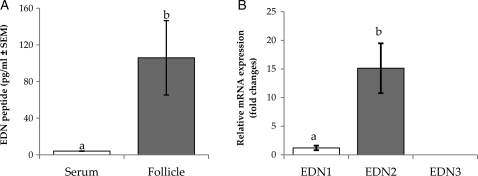
Figure 2.
Relative mRNA levels of endothelin subtypes in the GC and endothelin peptide levels of human pre-ovulatory follicles. (A) Endothelin peptide concentrations in the pre-ovulatory follicles (n = 6). The serum endothelin level was measured for reference. (B) Relative mRNA levels of endothelin subtypes calculated by using CT values from the real-time PCR (n = 8). The level of each mRNA was normalized with the corresponding β-actin transcript level. Data are the mean ± SEM, and different letters indicate significance at P < 0.05. The CT values of the EDN1 and EDN2 are 27.97 ± 0.58 and 24.38 ± 0.57, respectively.

