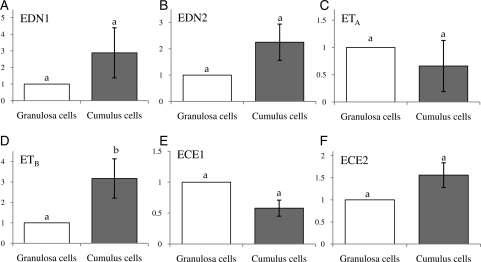
Figure 3.
Comparison of the endothelin component mRNA levels between human GCs and CCs. After real-time PCR, expression levels of each target gene in GCs and CCs were calculated from CT values, and the fold difference in the relative transcript level was determined against that of GC (n = 8). Data are the mean ± SEM, and different letters indicate significance at P < 0.05. Note a higher expression of ETB in the CC compared with GC.

