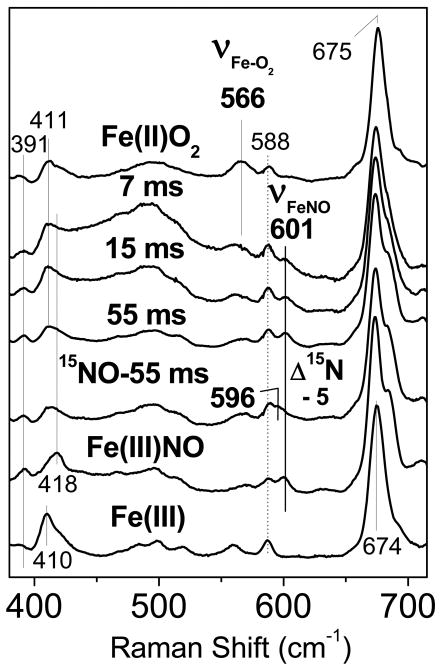
Figure 3.
Low-frequency RR spectra of RFQ samples of the reaction of 300 μM oxy-DevS with excess NO compared to those of resting oxy- (top trace), and Fe(III)NO-DevS and Fe(III)-DevS (bottom two traces). The spectrum of an RFQ sample frozen after 55 ms for the same reaction, but with excess 15NO is also shown (λexc = 413 nm, 20 mW; sample temperature ∼105 K).

