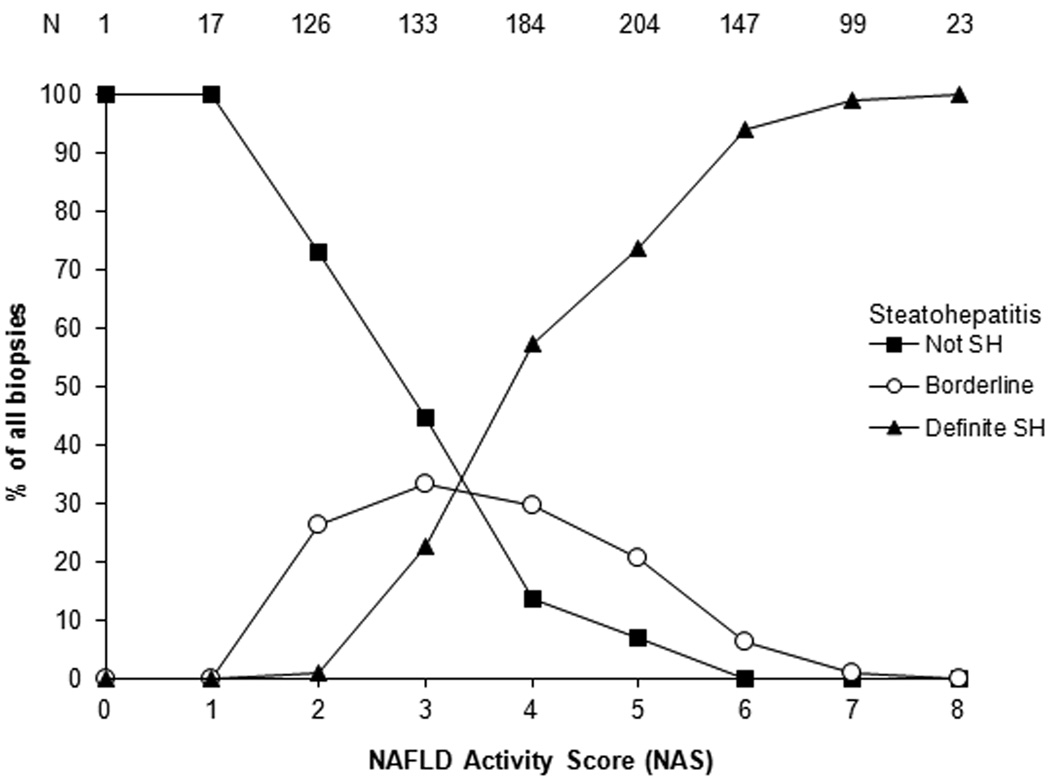
Figure 1.
shows the percentages of biopsies with diagnoses of definite steatohepatitis (closed triangle), borderline (probable) steatohepatitis (open circle) and definitely not steatohepatitis (closed square). As can be noted, the majority of definite SH are > 5 and the majority of not SH are <3, however, the scores and diagnostic categories are not as easily separated in the NAS 3–5 ranges.

