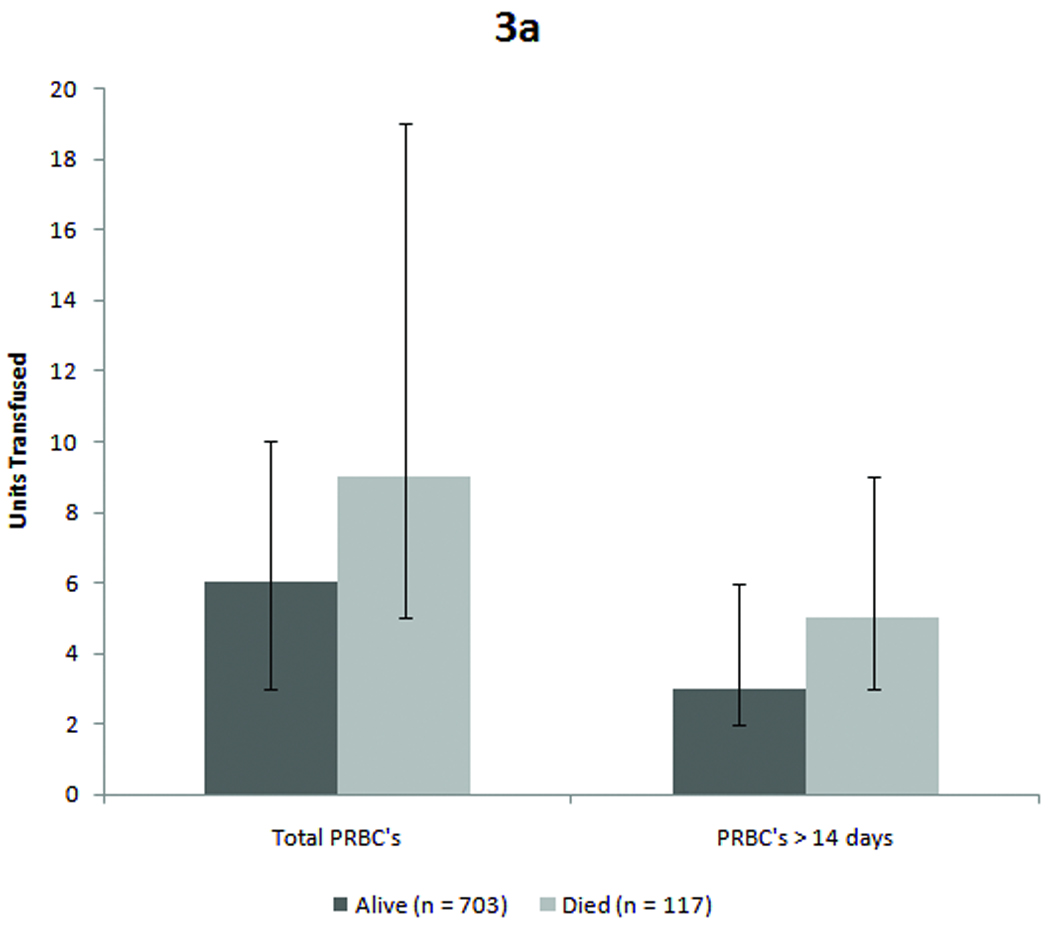
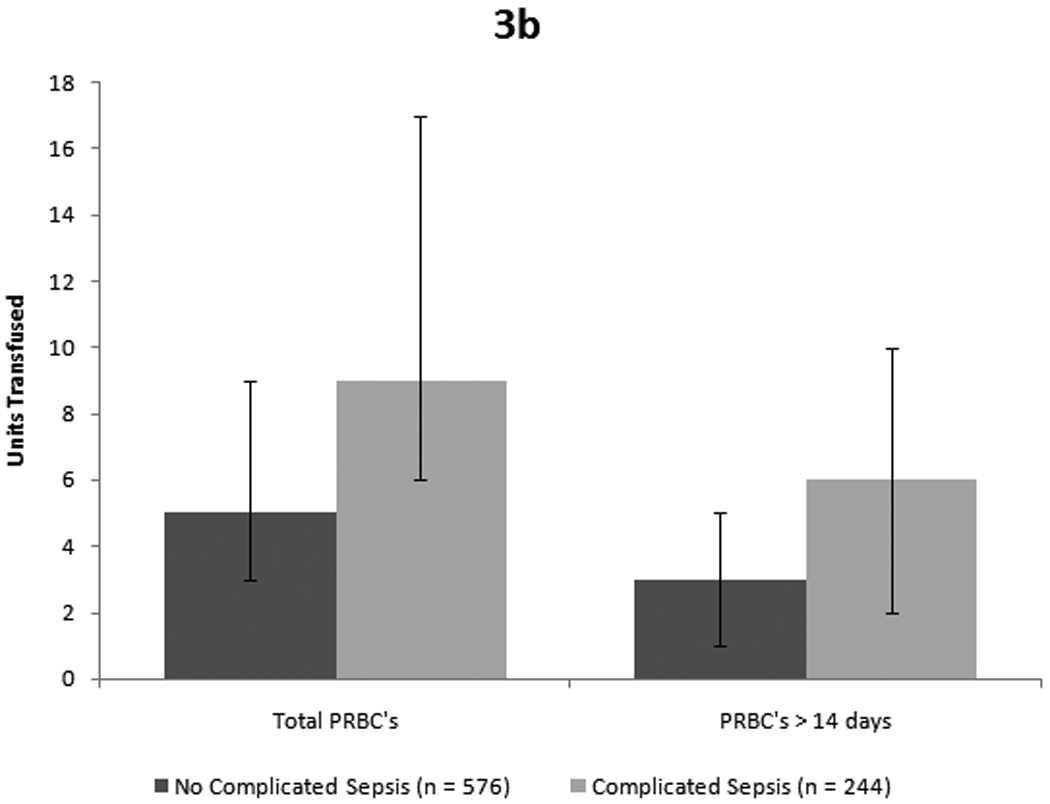
Figure 3. Mortality and infection outcome for entire cohort.


Figure 3a: Patients who died received significantly more units overall as well as a greater number of units of older blood. (p < 0.001 for total transfusions and p = 0.004 for older blood, both by Mann-Whitney-U test). Figure 3b: Similarly, patients who developed complicated sepsis received more blood overall and more units of older blood. (p < 0.001 for total PRBCs and p = 0.004 for older blood by Mann-Whitney-U test)
