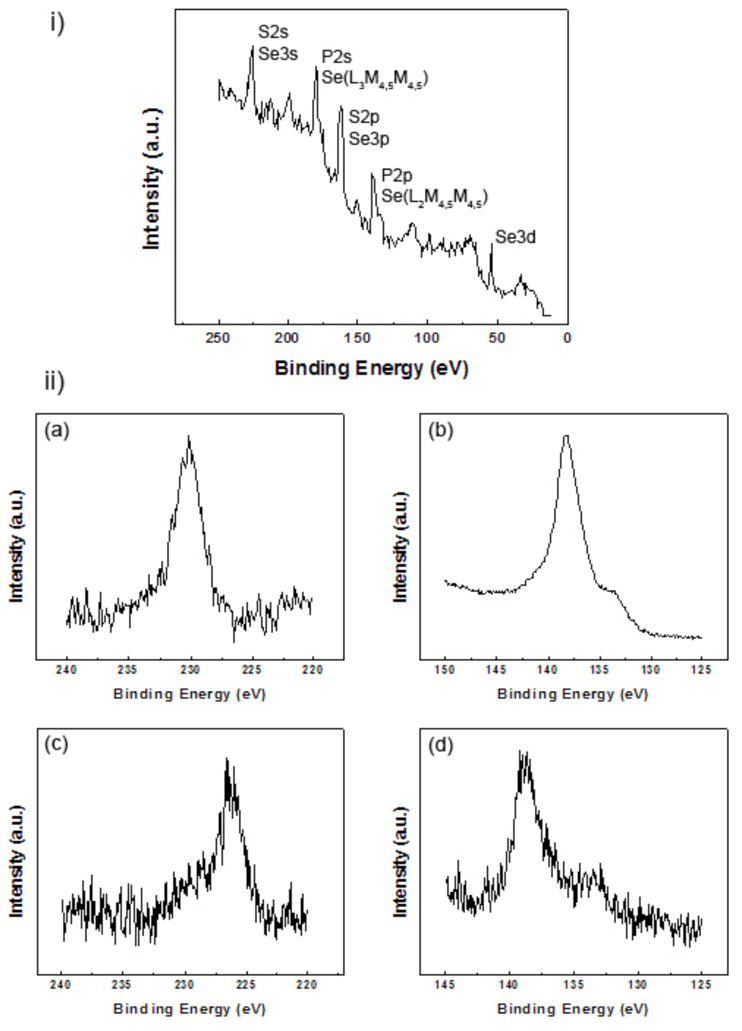
Figure 2.

XPS analysis of QDs. (i) Survey spectrum of CdSe/CdS/ZnS QDs in the binding energy range between 0 and 250 eV showing the overlap between the selenium peaks with the sulfur and phosphorous peaks. (ii) High resolution spectra of Se3s (a) and Se(L2M4,5M4,5) (b) measured from pure Se powder and S2s (c) and P2p (d) regions measured from CdSe/CdS/ZnS QDs.
