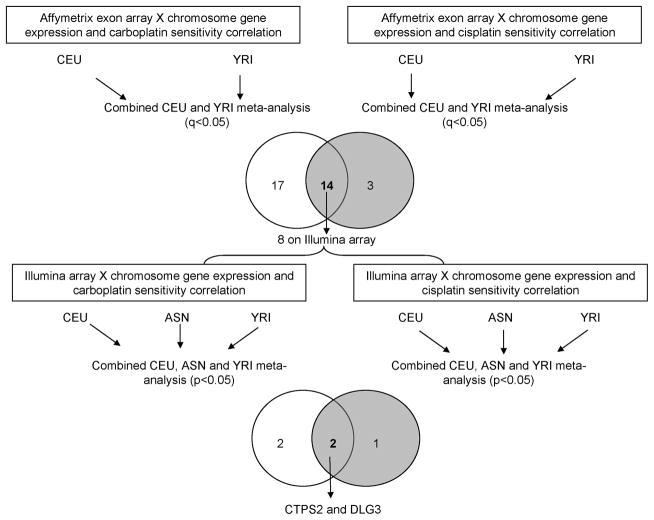
Figure 1.
Schematic diagram of the study. The top venn diagram shows the number of X chromosome genes whose expression significantly correlated with either carboplatin (left circle) or cisplatin (right circle) sensitivity (q<0.05). The number shown in the overlap region of the venn diagram represents the number of X chromosome genes whose expression significantly correlated with sensitivity to both platinums. When evaluating these 14 genes on Illumina array via meta-analysis, 4 (2+2) also correlated with carboplatin sensitivity (left circle) and 3 (1+2) correlated with cisplatin sensitivity (right circle). CEU = Caucasian; YRI = Yoruba people from Ibadan, Nigeria; ASN= Asian.

