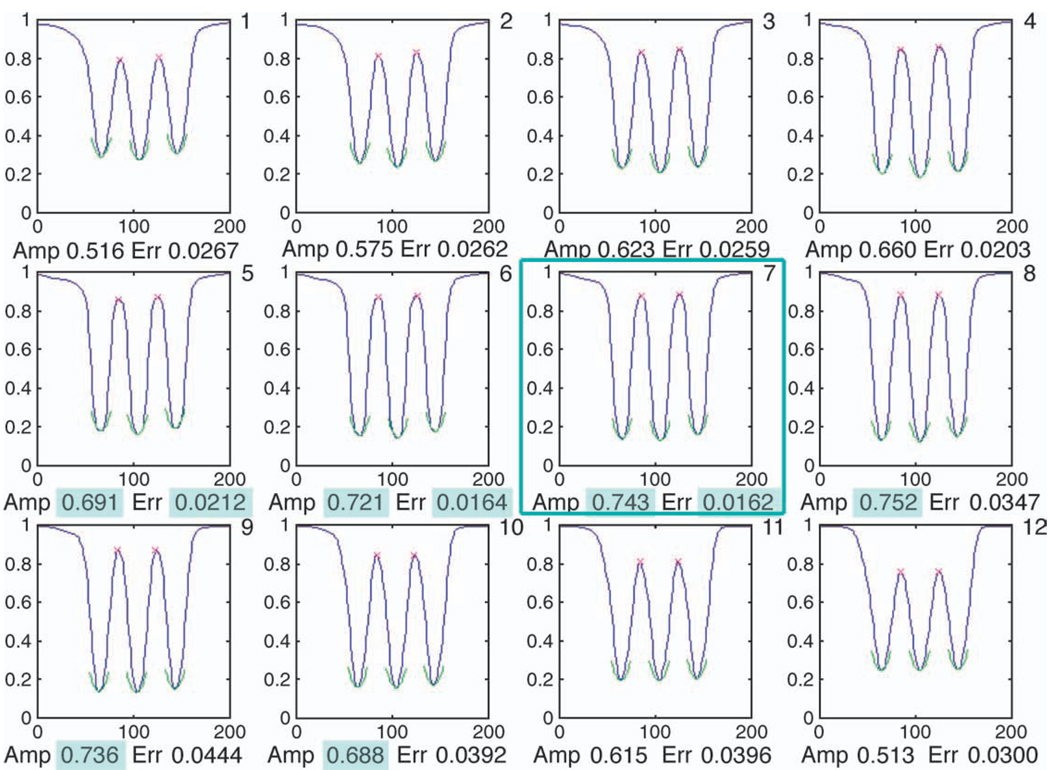
Figure 2.
An example of the sequence of 12 intensity profiles for the upright E, used by the CAG algorithm. The green arcs show the parabolic functions fitted to the location of the 3 minima. The 6 images with the highest values for contrast amplitude (highlighted in green) were 5 to 10. The 3 images with the lowest RMS errors for the fitted parabola (highlighted in green), corresponding to the highest contrast gradients, were 5 to 7. Image 7 was chosen by the algorithm to best optimize both contrast amplitude and gradient (framed in green).

