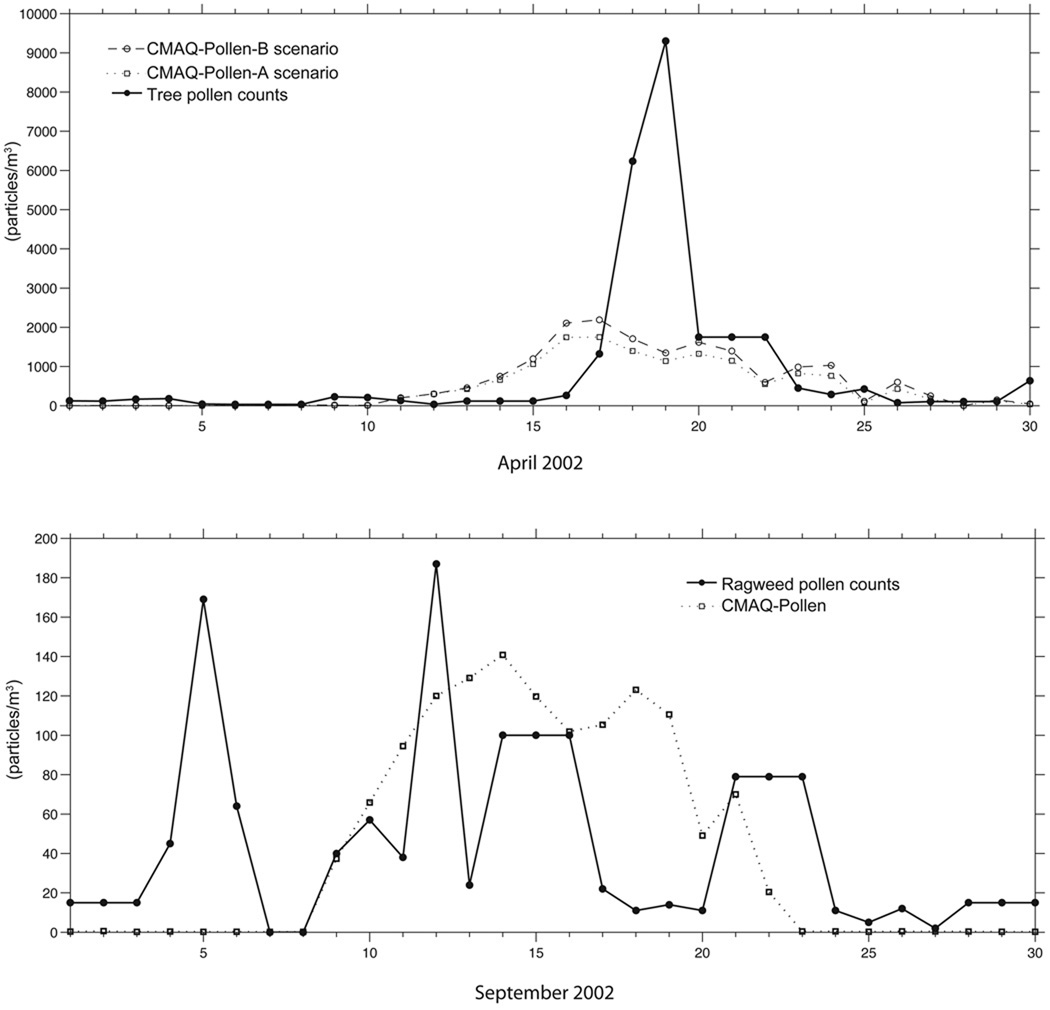
Figure 12.
Comparison plot showing CMAQ-pollen model estimates and observed pollen levels in Newark, NJ for the months of April and September, 2002. The top panel shows estimates using alternative assumptions for pollen emissions: in the CMAQ-pollen-A simulation, all birch pollen emissions were allocated to the first layer in the vertical dimension (from ground to 20 m), while in the CMAQ-pollen-B simulation, 80% of emissions were allocated to the first layer, and 20% were allocated to the second layer (20 to 50 m). In the ragweed simulation case (bottom panel), all emissions were allocated to the first layer.

