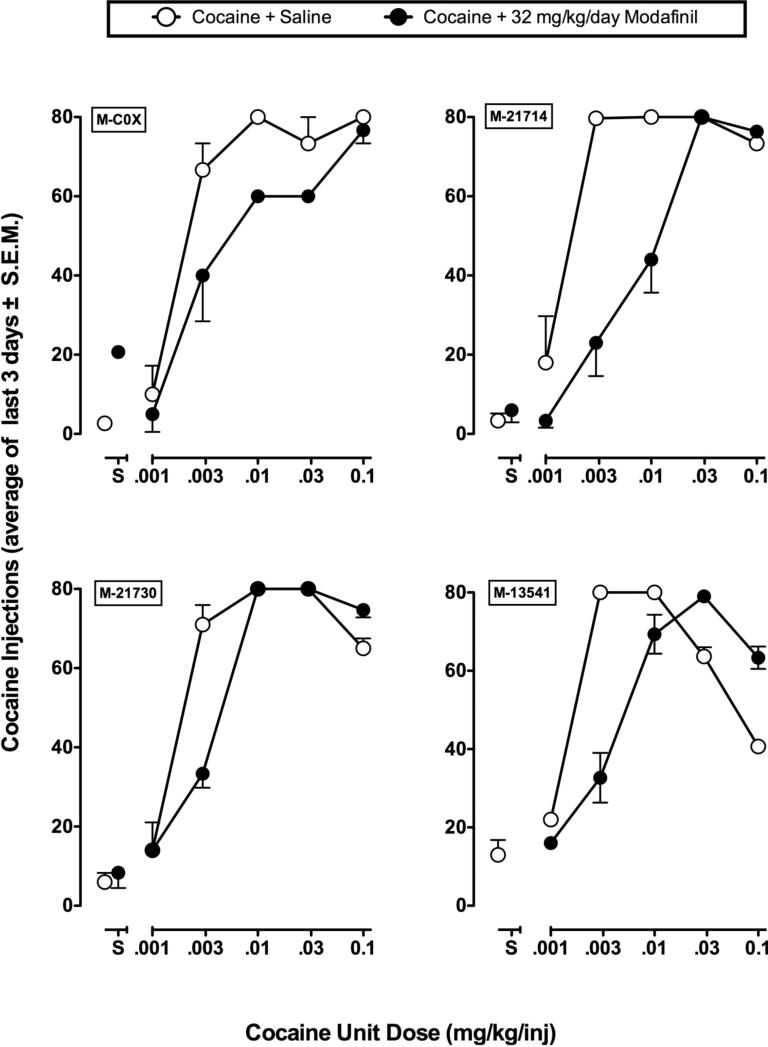
Figure 4.
Effects of modafinil on the cocaine self-administration dose-effect curve in individual monkeys. Ordinate: numbers of cocaine injections self-administered per day during baseline conditions (open symbols) and during chronic modafinil treatment (filled symbols). Points above ‘S’ show data collected when saline was the solution available for self-administration. Each data point shows the mean ±SEM from the last three days of each cocaine dose condition. The identification number for each monkey is shown in the upper left of each panel.

