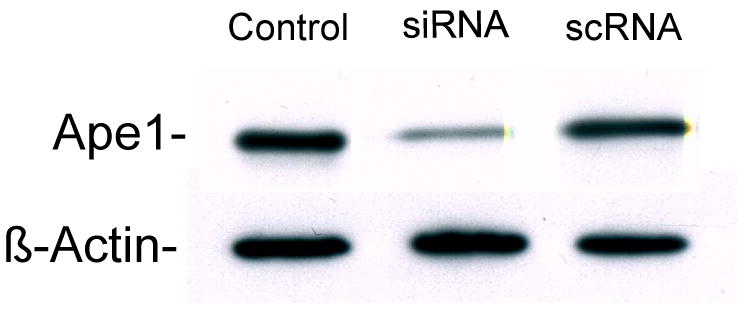
Figure 1.

Representative Western blot showing the level of expression of Ape1 protein 48 h after transfection of HeLa CCL2 cells. Cells were transfected and processed for SDS-PAGE and Western blotting as described in Materials and Methods. Membranes were probed with anti-Ape1 antibody. β-actin was used as a loading control. The lane denoted as Control represents cells that were incubated with Oligofectamine, but not transfected. Cells transfected with scRNA showed Ape1 expression that was approximately within 95% of expression observed in untransfected control cells. Cells transfected with siRNA showed Ape1 expression that was approximately only 22% of that found in untransfected control cells, and expression in siRNA-transfected cells was reduced to 25-30% of that found in scRNA-transfected cells.
