Fig. 6.
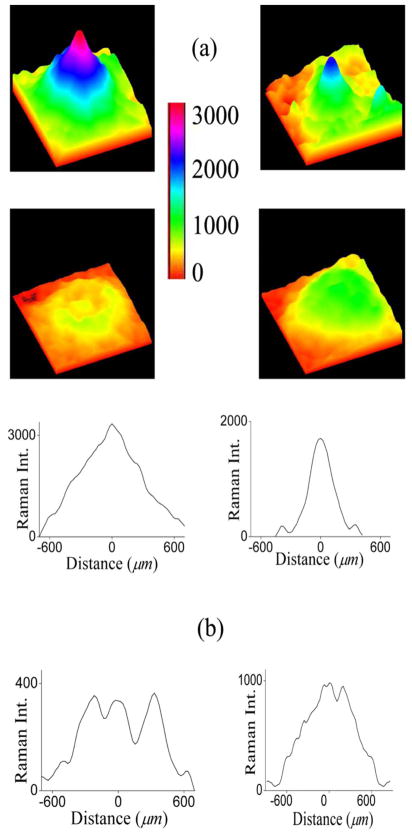
(Color online) (a) Pseudocolor-scaled, three-dimensional MP RRI images obtained from four healthy subjects, demonstrating significant intersubject variations in MP levels, symmetries, and spatial extent. Note ringlike MP distribution with small central MP peak and overall low levels in one of the cases (lower left). All images are color coded with the same intensity bar. (b) Intensity plot profiles derived for each MP distribution from pixel intensity maps (22×1400 μm rectangles) running along nasal–temporal meridians through the center of the macula.

