
Fig. 7.
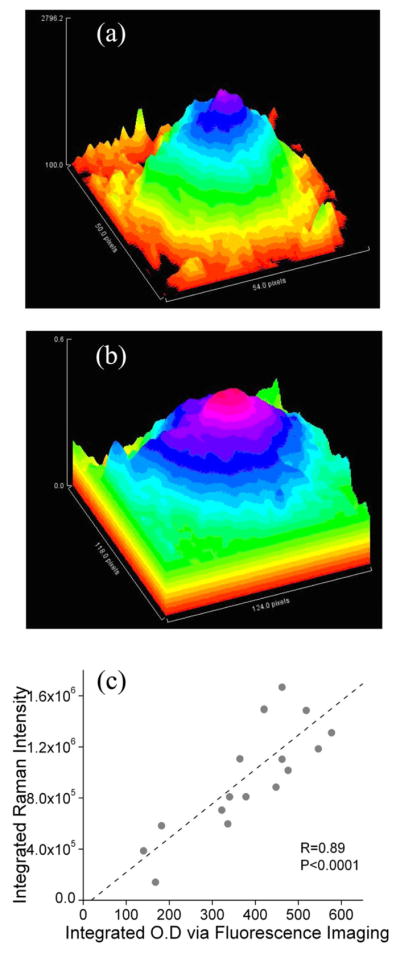
(Color online) Images of MP distributions obtained for the same subject with (a) RRI and (b) fluorescence-based imaging. (c) Comparison of integrated MP densities obtained for 17 subjects with Raman- and fluorescence-based imaging methods. Vertical scale shows integrated MP densities derived from RRI images by integrating intensities over the whole macular region; horizontal scale shows corresponding densities derived via fluorescence imaging. A high correlation coefficient of R=0.89 is obtained for both methods, using a best fit that is not forced through zero. If the fit is forced through zero (not shown), one obtains a correlation coefficient R=0.80.