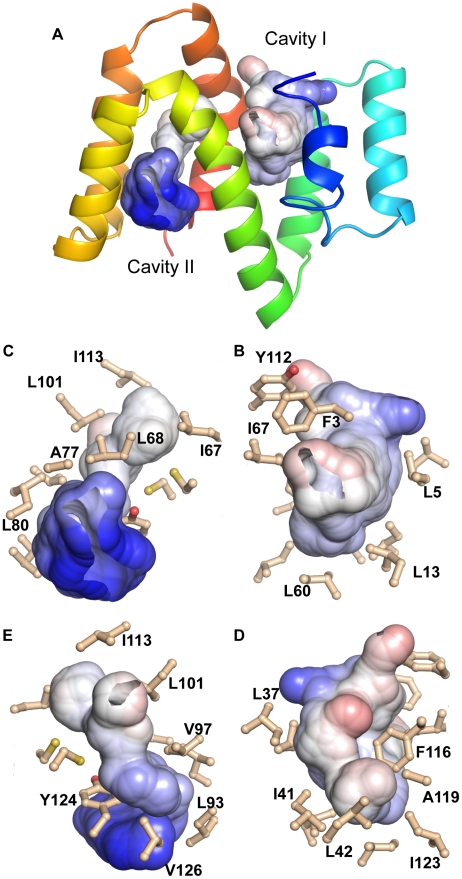
Figure 4. ABA-1A's ligand binding cavities.
Molecular surfaces of the atoms lining the ligand binding cavities (probe radius 1.4 Å, cavities truncated at 3 probe radii) coloured by contact potential (blue, positive, graded through white, apolar, to red, negative). (A) Ribbon representation of ABA-1A with the binding cavities added, oriented with the N-terminal domain to the right as in Figure 3B. (B and C) The cavities in the same orientation but enlarged and with the residues lining the cavities displayed as sticks, illustrating the dominant apolarity of the cavities and the cluster of positively charged sidechains at the entrance of Cavity II. (D and E). The cavities rotated 180° about the vertical axis. Note that Trp15 does not contribute to any cavity surface.

