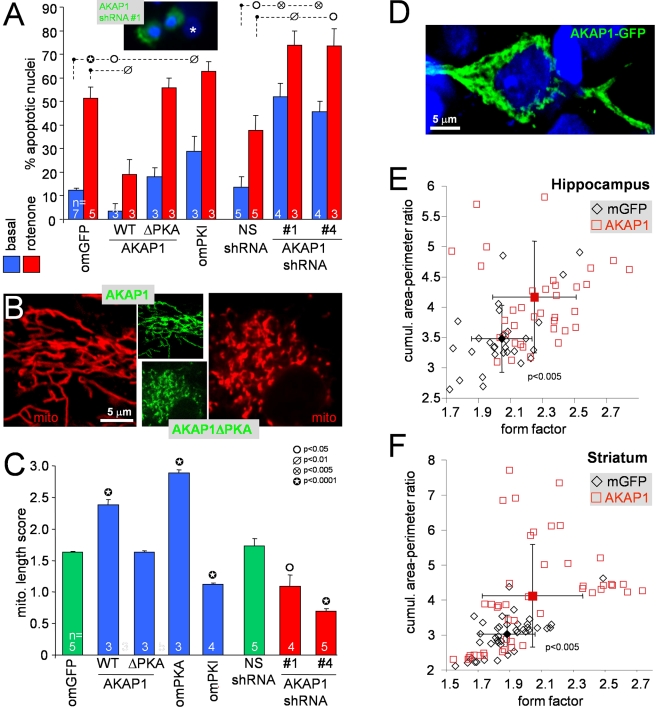
Figure 3. Mitochondrial PKA and AKAP1 promote neuronal survival and oppose mitochondrial fragmentation in vitro and in vivo.
(A) Hippocampal neurons were transfected with the indicated cDNA and shRNA plasmids (AKAP1ΔPKA = I310P,L316P [PKA binding defective]; Figure S2C). After 3 d, cells were treated ± 400 nM rotenone for 2 d, fixed, and analyzed by counting apoptotic nuclei in the transfected neuron population (means ± s.e.m. of n = 3–7 experiments). The inset shows two transfected neurons (green) with apoptotic nuclei and an untransfected neuron with normal nucleus (asterisk). (B, C) Representative confocal sections of TMRM-stained (mito) hippocampal neurons (B) and their mitochondrial length scores (C) 3 d after transfection with the indicated cDNA and shRNA constructs are shown (means ± s.e.m. of n = 3–5 experiments; Student's t test comparisons between GFP fusion proteins and omGFP and between AKAP1 and NS shRNAs). (D–F) Rats injected with lentivirus expressing mitochondrial (m)GFP and AKAP1-GFP into the hippocampus and striatum of left and right hemispheres, respectively, were analyzed 7–14 d later for mitochondrial shape. Perfusion-fixed cryostat sections immunolabeled for GFP (representative confocal image in (D), counterstained for nuclei with TOPRO-3 [blue]) were subjected to ImageJ software-based morphometry. Scatter plots (E, F) correlate form factor (inverse of circularity of individual mitochondria) with cumulative area:perimeter ratio (a measure of network connectivity). Each open symbol represents average shape metrics from 10–22 z-sections of one neuron; filled symbols are population averages (± s.d., 29–42 neurons per condition from 2 (E) and 3 (F) rats).

