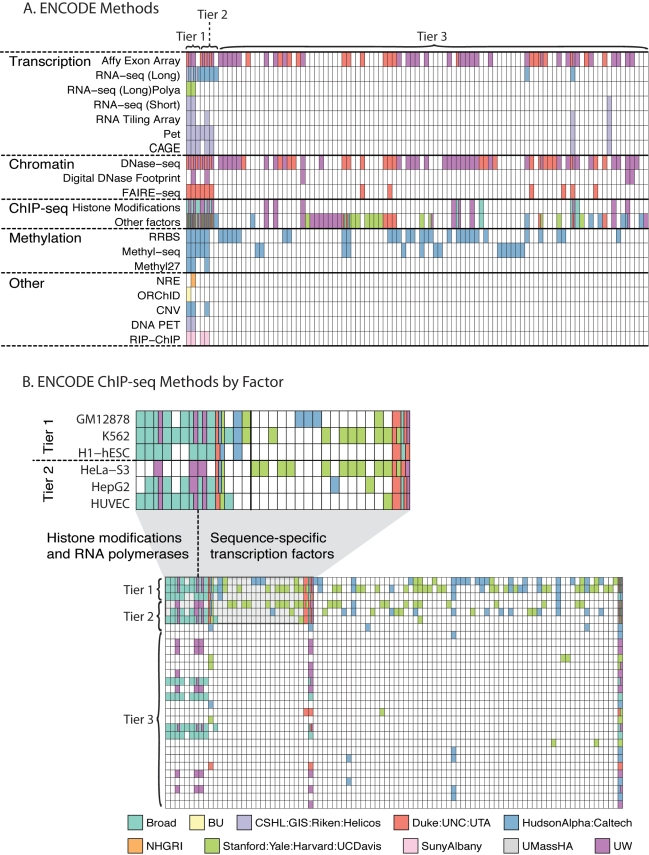
Figure 2. Data available from the ENCODE Consortium.
(A) A data matrix representing all ENCODE data types. Each row is a method and each column is a cell line on which the method could be applied to generate data. Colored cells indicate that data have been generated for that method on that cell line. The different colors represent data generated from different groups in the Consortium as indicated by the key at the bottom of the figure. In some cases, more than one group has generated equivalent data; these cases are indicated by subdivision of the cell to accommodate multiple colors. (B) Data generated by ChIP-seq are split into a second matrix where the cells now represent cell types (rows) split by the factor or histone modification to which the antibody is raised (columns). The colors again represent the groups as indicated by the key. The upper left corner of this matrix has been expanded immediately above the panel to better illustrate the data. All data were collected from the ENCODE public download repository at http://hgdownload.cse.ucsc.edu/goldenPath/hg18/encodeDCC on September 1, 2010.

