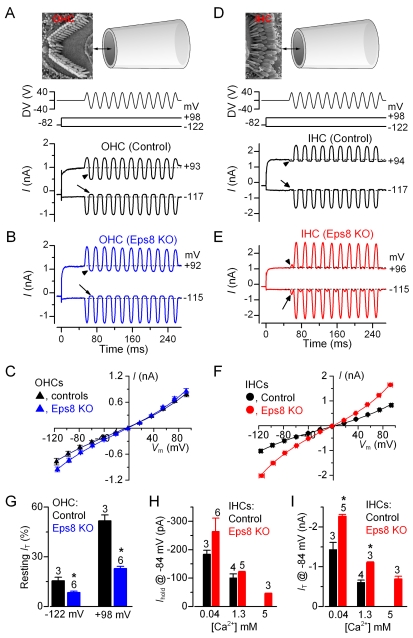
Figure 5. Mechano-electrical transducer current in Eps8 cochlear hair cells.
(A and B) Saturating transducer currents recorded from a control (A) and a knockout (B) apical-coil Eps8 OHC by applying sinusoidal force stimuli of 50 Hz to the hair bundles. The driver voltage (DV) signal of ±40 V to the fluid jet is shown above the traces (for OHCs, negative deflections of the DV are inhibitory). The top panels show the orientation of the fluid jet (not to scale) with respect to the OHC (A) and IHC (D) hair bundle. OHC membrane potentials were stepped between −122 mV and +98 mV in 20 mV nominal increments from the holding potential of −82 mV. For clarity only a few responses are shown (membrane potentials next to the traces have been corrected by the voltage drop across the residual series resistance). The arrows and arrowheads indicate the closure of the transducer channels open at rest (i.e. resting current) elicited during inhibitory bundle displacements at hyperpolarized and depolarized membrane potentials, respectively. Note that the resting current increases with membrane depolarization. Dashed lines indicate the holding current, which is the current at the holding membrane potential. (C) Peak-to-peak current-voltage curves were obtained from three control and six knockout OHCs (P8–P9) using 1.3 mM extracellular Ca2+. The fits through the data are according to a simple single-energy-barrier model: I(V) = k [exp ((1−γ)(V−V r)/V s )−exp (−γ(V−V r )/V s)], where k is a proportionality constant, V r is the reversal potential, V s is a measure for the steepness of the rectification, and γ is the fractional distance within the membrane's electrical field of an energy barrier, as measured from the outside. Average parameters were obtained from fits to individual cells and were: control k = 284±37, V r = −5.4±0.7 mV, V s = 46±2 mV, and γ = 0.45±0.01; Eps8 KO k = 306±33, V r = −2.4±0.3 mV, V s = 42±2 mV, and γ = 0.45±0.01. (D and E) Saturating transducer currents recorded from a control and a knockout IHC. Note that because of the different orientation of the hair bundles in respect to the fluid jet used between OHC and IHC recordings (see top panels in A and D), negative pressure at the tip of the jet caused excitatory responses in IHCs. In knockout IHCs, a small current in the excitatory direction was elicited during inhibitory bundle displacements (this current was not present in control IHCs: arrows and arrowheads). (F) Peak-to-peak current-voltage curves were obtained from four control and three knockout IHCs (P6–P8). Control: k = 386±102, V r = +1.2±1.8 mV, V s = 51±10 mV, and γ = 0.47±0.01. EPS8 KO: k = 459±20, V r = −1.3±1.3 mV, V s = 46±1 mV, and γ = 0.48±0.01. (G) Changes in the resting transducer current at two nominal membrane potentials in control and knockout immature (P8–P9) OHCs. The resting current is given by the holding current minus the current present during inhibitory bundle deflection. (H and I) Holding current (H) and transducer current (I) at the membrane potential of −84 mV in control and knockout IHCs in the presence of 0.04 mM (endolymph-like), 1.3 mM, and 5 mM extracellular Ca2+. Note that 5 mM Ca2+ was only tested in knockout IHCs. Transducer current recordings were made at room temperature.

