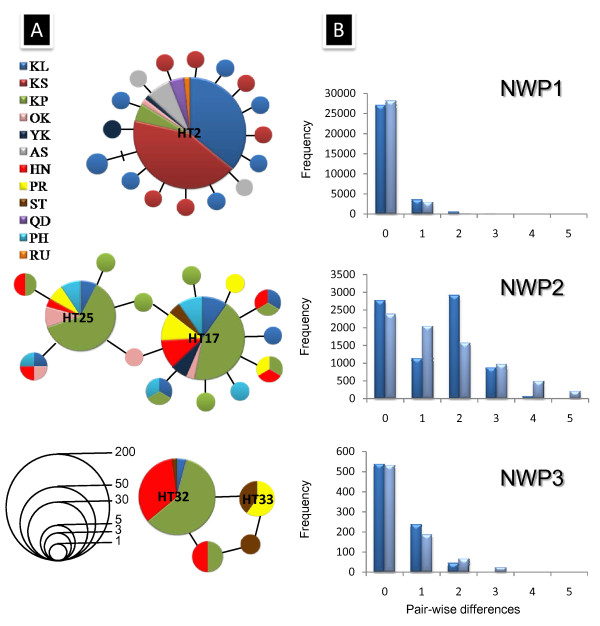
Figure 3.
Haplotype networks and mismatch distribution for three lineages of Mugil cephalus COI sequences. (A) Haplotype networks for three lineages of Mugil cephalus COI sequences. The lengths of the connecting lines are in relation to the number of mutations between haplotypes. Each circle represents a haplotype, with the diameter of the circle proportional to the number of sequences of that haplotype. The names of the major haplotypes for each cryptic species correspond to those listed in Table S1. (B) Mismatch distributions from the mtDNA COI sequences of M. cephalus from the ten sampling locations. Blue bar: observed distributions; Light blue bar: expected distributions from the sudden expansion model.

