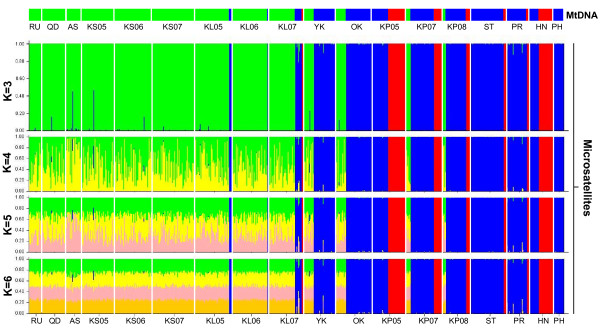
Figure 4.
Correspondence between mtDNA lineages and nuclear Structure clusters. First row is the distribution of the 3 mtDNA lineages (green: lineage 1, blue: lineage 2, red: lineage 3) in 18 samples of Mugil cephalus in NW pacific. Second to forth row are the results of the assignment test using STRUCTURE [49] for M. cephalus microsatellite data. Each cluster (K) is designated by a different colour with vertical bars representing individuals and the proportion of a bar assigned to a single colour representing the posterior probability that an individual is assigned to that cluster. Assignment results are shown with K = 3, 4, 5 and 6.

