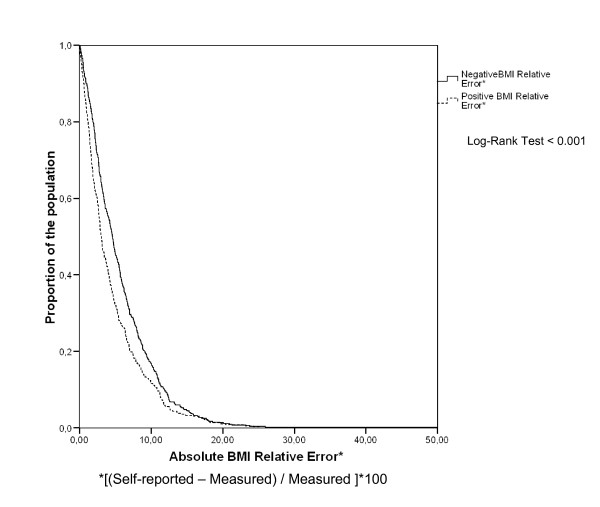
Figure 2.
Survival agreement Plot for Body Mass Index (BMI). *[(Self-reported - Measured)/Measured ]*100 Log-Rank Test < 0.001 Survival agreement Plot as proposed by Luiz et al. (J Clin Epidemiol 2003; 56:963-7). The x-axis shows the absolute difference between self-reported and measured weight (kg), and the y-axis shows the proportions of observations with differences that are at least those in the x-axis. Separate lines for negative difference (self-reported-measured; infra-reported) and continuous line for positive difference (self-reported-measured; over-reported).

