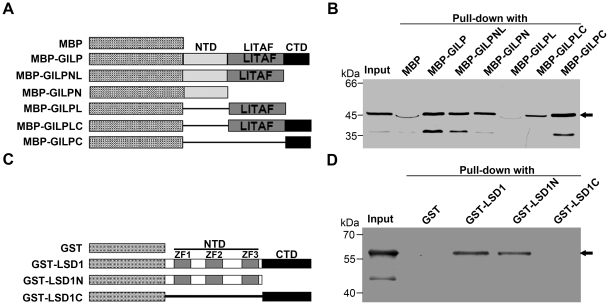
Figure 4. Domain mapping of the interaction between AtGILP and AtLSD1.
(A) Schematic diagram of AtGILP mutants. LITAF, NTD, and CTD represent the LITAF domain, N-terminal domain, and C-terminal domain, respectively. (B) AtLSD1 interacts with both the N-terminal and the C-terminal domains of AtGILP. Purified MBP (control), MBP-AtGILP, MBP-AtGILPNL, MBP-AtGILPN, MBP-AtGILPL, MBP-AtGILPLC, or MBP-AtGILPC was incubated with GST-AtLSD1 supernatant and amylose agarose beads. Pulled-down proteins and “Input” sample (GST-AtLSD1 supernatant) were detected by Western blot using an anti-GST monoclonal antibody. Arrow indicates the GST-AtLSD1 protein band. (C) Schematic diagram of AtLSD1 mutants. zf1, zf2, and zf3 indicate the first, second, and third zinc finger domain, respectively. NTD and CTD represent N-terminal and C-terminal domain, respectively. (D) AtGILP interacts with the NTD of AtLSD1. GST (control), GST-AtLSD1, GST-AtLSD1N, or GST-AtLSD1C supernatant was incubated with purified MBP-AtGILP and glutathione agarose beads. Pulled-down proteins and “Input” sample (purified MBP-AtGILP) were detected by Western blot using an anti-MBP polyclonal antibody. Arrow indicates the MBP-AtGILP protein band.

