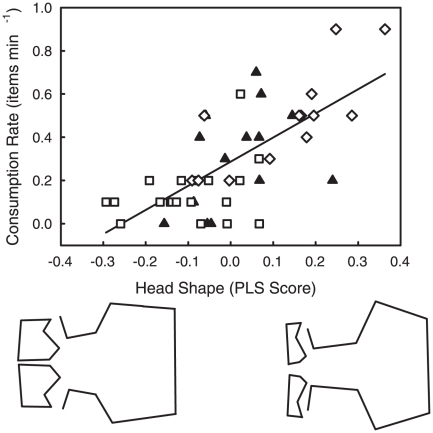
Figure 2. Head shape (PLS score) plotted against food consumption rate for high predation (open squares), low predation (open diamonds), and introduced (filled triangles) guppy populations.
Head shape was a significant predictor of feeding rate. All three populations were significantly differentiated along the “feeding performance” axis. In the introduced population, the morphological features that enhanced foraging performance evolved away from the original high predation state and towards the natural low predation state. Deformation images represent the extremes of the PLS vectors exaggerated by a factor of 3 to aid in interpretation.

