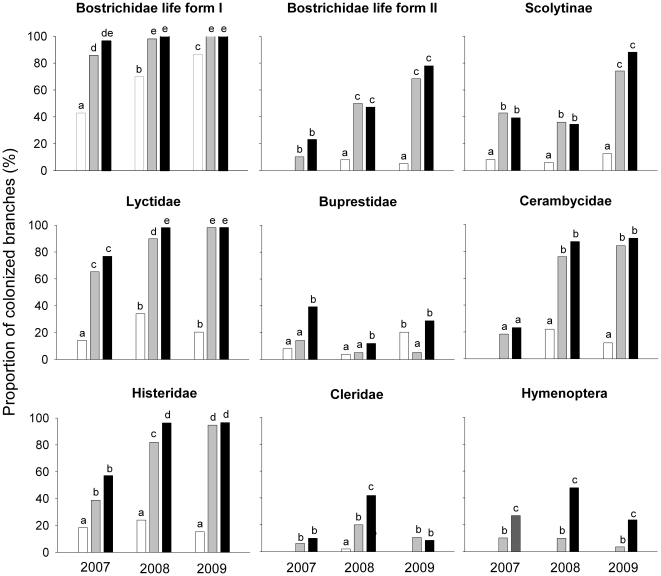
Figure 2. Branch colonization frequency by secondary colonizers.
Non-engineered branches are represented by white bars (NE); simulated-engineered branches by gray bars (SE); and O. albomarginata chamela- engineered branches by black bars (OE). Values are the percentage of branches colonized. Different letters indicate significant differences (P<0.05) between the frequencies of branch colonization of the treatments.

