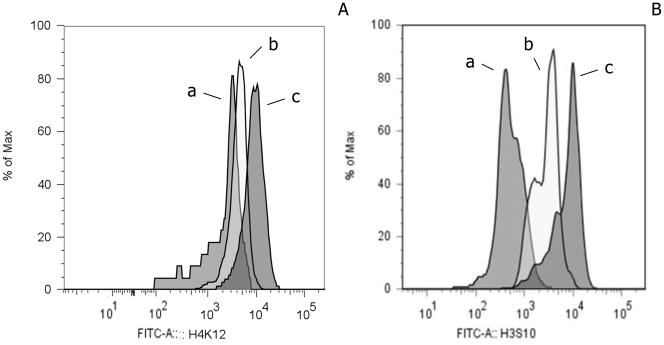
Figure 2.
Examples of flow cytometric immunofluorescence with fluorochrome conjugated anti-H4-K12 Ac or anti-H3-S10 P04 for CD56+ lymphocytes. Panel (A) global H4-K12 Ac pattern for lymphocytes derived from a woman with of the greatest perceived stress score is represented by pattern (a) (global MFI = 1,499), an intermediate level by pattern (b) (global MFI = 4,043) and the least perceived stress score by pattern (c) (global MFI = 8,245). Data are presented as the percentage of maximum cell number. (B) Global H3-S10 PO4 pattern for lymphocytes from a woman with the greatest perceived stress score is represented by pattern (a) (global MFI = 280), an intermediate level by pattern (b) (global MFI = 2112) and the least perceived stress score by pattern (c) (global MFI = 7416). Isotype control antibody exhibited an MFI < 150.

