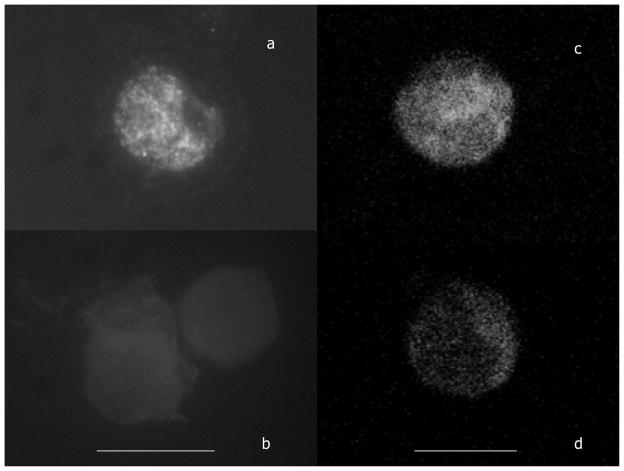
Figure 3.
Nuclear immunofluorescence of CD56+ lymphocytes stained with fluorochrome conjugated anti H4-K12 Ac. Figure 3a and c depict the fluorescence microscopic appearance of CD56+ lymphocyte nuclei derived from a woman with a high MFI and Figure 3b and d depict the fluorescence microscopic images of CD56+ lymphocyte nuclei derived from a woman with low MFI. (a and b) are microscopic images of entire cells stained as well with DAPI to identify nuclear DNA, (c and d) are z patterns through the center of nuclei. These images are provided in color as supplemental material online. The line for the microscopic images is 10 microns and for the confocal images is 7 microns.

