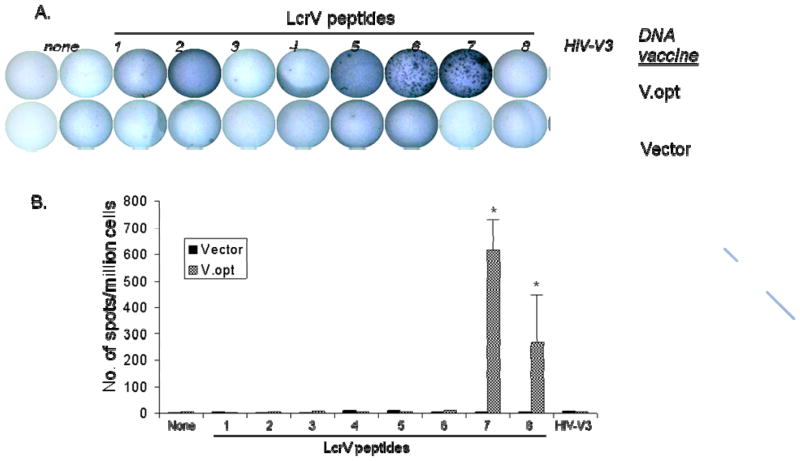
Fig. 1.
ELISPOT analysis for IFN-γ secretion in mouse splenocytes immunized with V.opt DNA vaccine or empty vector. (A) Actual sample wells of IFN-γ ELISPOT with LcrV peptide stimulations, HIV-V3, or no stimulation, as indicated. (B) Frequency of LcrV peptide-specific IFN-γ spots per million splenocytes in mice immunized with the various V.opt DNA vaccines or empty vector. Data represent the average number of spot forming cells (SFCs) per million of splenocytes from 5 mice/group ± standard deviation. “*” shows the statistical difference, p<0.05. Splenocytes were collected at 1 week after the last (4th) DNA immunization.

