Fig 2.
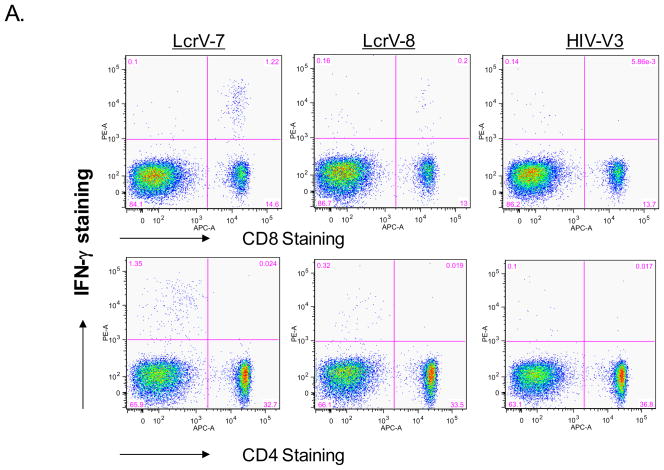
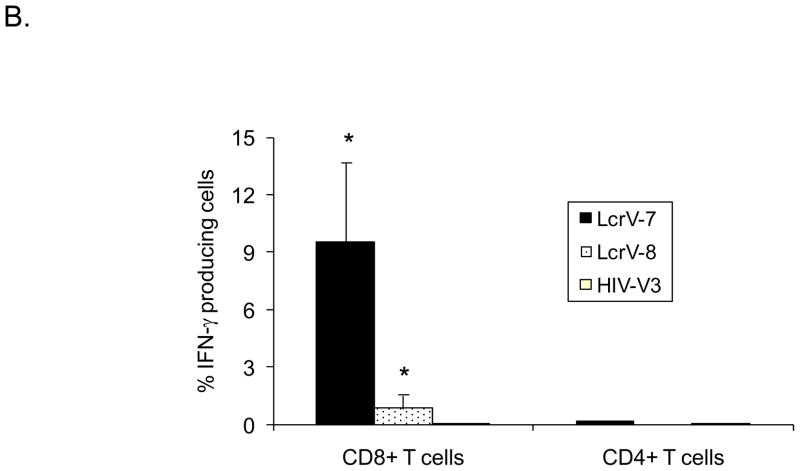
Intracellular cytokine staining (ICS) analysis of IFN-γ production in CD8+ and CD4+ T cells isolated from mouse spleens immunized with V.opt DNA vaccine. (A) A set of sample FACS data, showing IFN-γ production in CD8+ or CD4+ T cells with LcrV-7, LcrV-8, or HIV-V3 peptide stimulation, as indicated. (B) Percent of peptide-specific IFN-γ production cells in CD8+ or CD4+ T cells following LcrV-7, LcrV-8, or HIV-V3 peptide stimulation. Data represent the average of 5 mice/group ± standard deviation. “*” shows the statistical difference, p<0.05. Splenocytes were collected at 1 week after the last (4th) DNA immunization.


