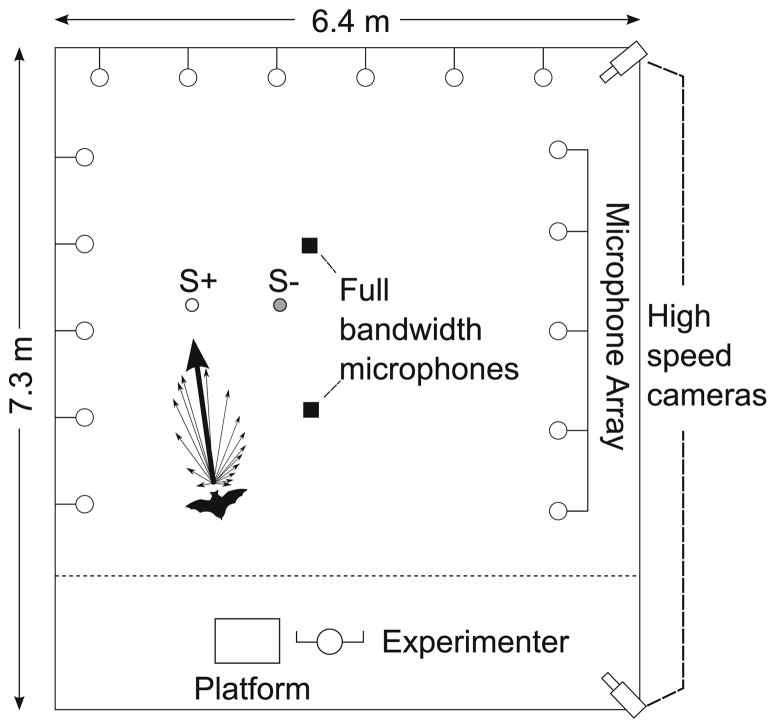
Fig. 1.
Flight room setup: top down schematic of flight room during recording sessions (not to scale). Sixteen microphones were located on three sides of the room. Two high-speed cameras (240 Hz) were located in the corners of the room and allowed for three-dimensional (3-D) tracking of the bat’s flight path. S+ (white circle) and S− (gray circle) were located in the flight room. Two full bandwidth microphones (black squares) were located on the floor near the objects. The bat’s vocalization has been depicted as arrows representing normalized intensities recorded at each array microphone. The thickest arrow in the schematic represents the calculated beam direction for this example vocalization. The dotted line shows the extent of 3-D reconstruction by the two high-speed cameras

